


Slide 1: GP Surgery predictive analytics on future patient numbers
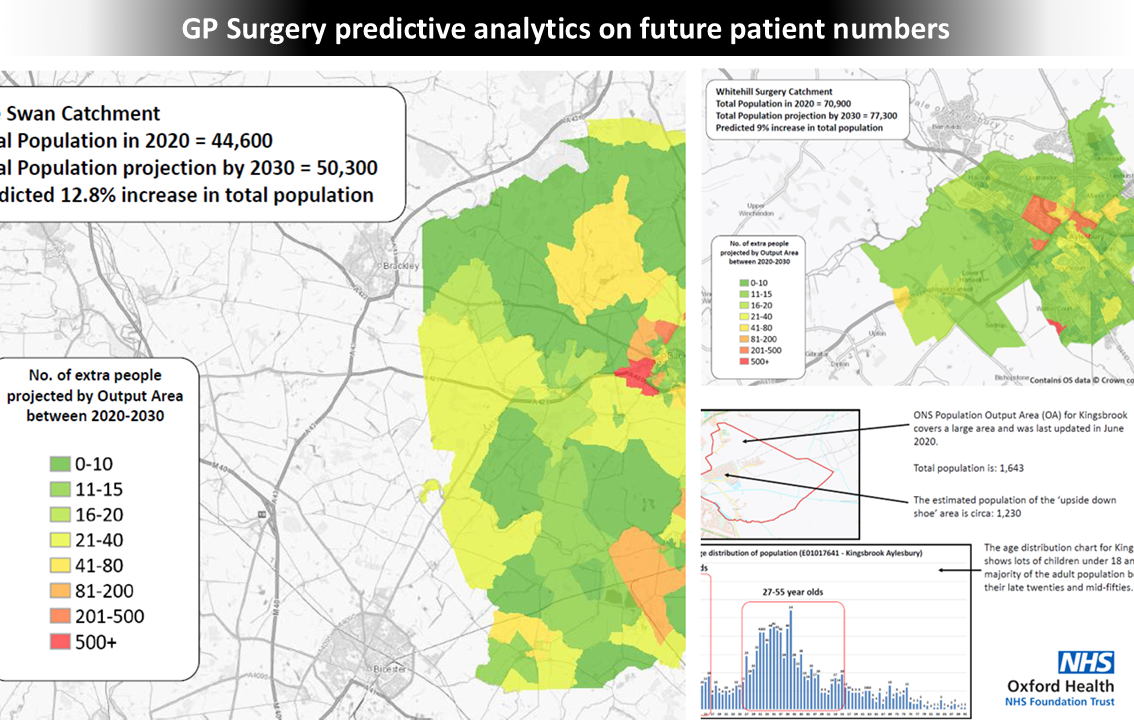
Situation: An NHS trust needed robust evidence to plan for projected growth in the urban population and assess whether existing GP surgeries could meet future patient demand.
Actions: I developed predictive analytics to forecast future GP patient numbers, analysing population growth trends and demand pressures to model different capacity scenarios.
Results: The analysis directly supported strategic decision-making, informing whether to expand existing GP surgeries or invest in the construction of a new facility to meet anticipated demand.
Slide 2: Determinants of health outcomes analysis & posters
Situation: Public health stakeholders needed a compelling way to communicate how different factors influence health outcomes across communities.
Actions: I conducted spatial analysis and produced clear, visually engaging posters for a regional public health event, demonstrating how geographic data can reveal variations in health determinants.
Results: The work showcased the value of data-driven insights in public health, strengthening understanding of how spatial analysis can inform targeted campaigns and intervention strategies.
Slide 3: Analysis to inform unemployment support strategy
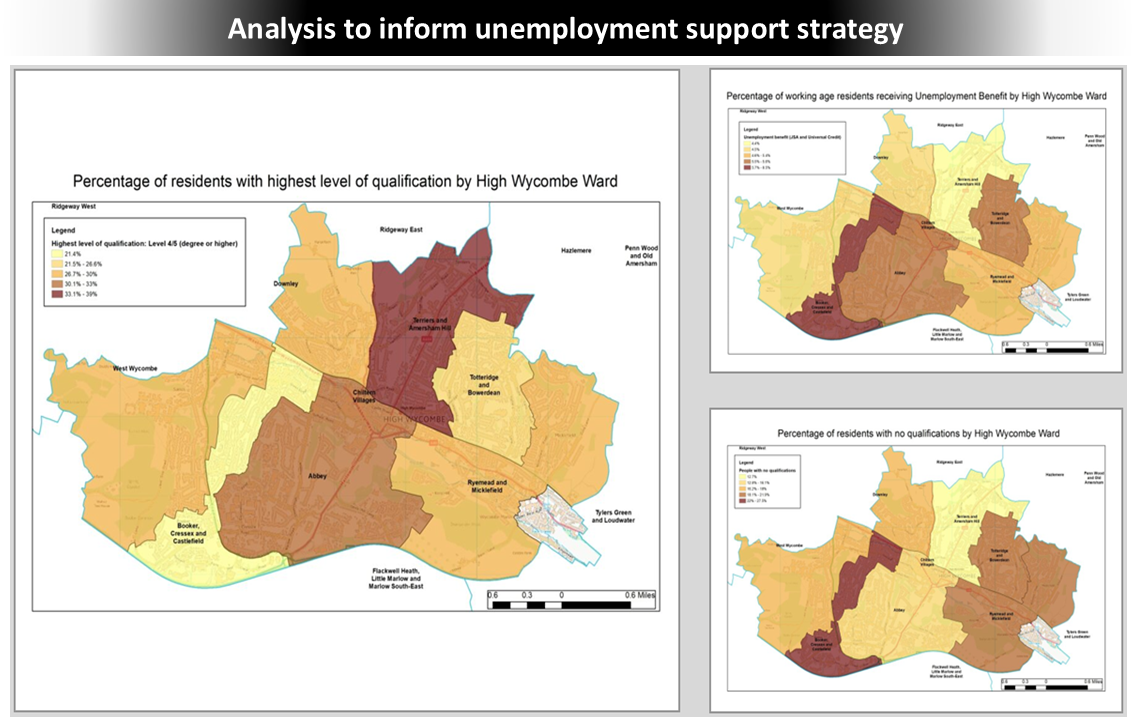
Situation: A local Citizens Advice Bureau branch and town council required evidence to better understand patterns of unemployment and insecure employment in High Wycombe.
Actions: I conducted geospatial analysis of census data to identify areas with higher levels of employment vulnerability and related socioeconomic challenges.
Results: The insights informed the planning of targeted community drop-in sessions and skills boot camps, helping to focus support on residents most in need.
Slide 4: Non-EU Country Higher Education Student Enrolments in the UK
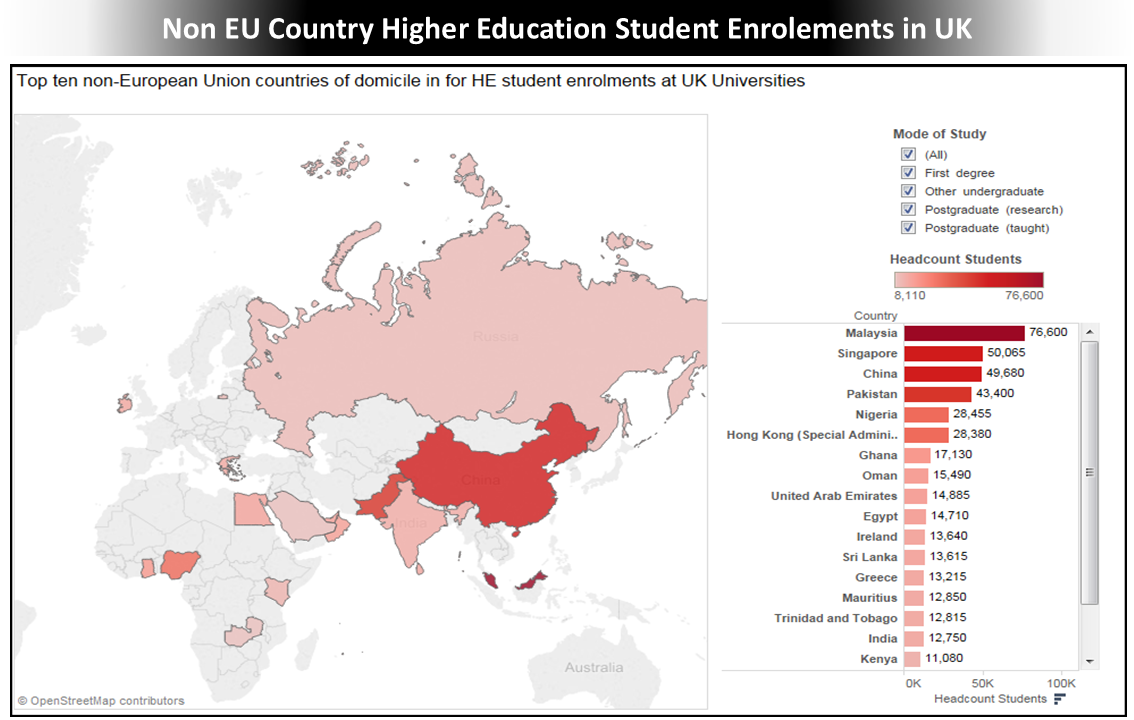
Situation: A UK university’s marketing team struggled to influence decision-makers due to fragmented and overly complex data presentations on international student recruitment.
Actions: I applied spatial analysis to enrolment data to create a cohesive, visually compelling narrative that highlighted patterns in non-EU student demand.
Results: The analysis transformed the data into a clear, persuasive story, enabling the development of a targeted international marketing campaign and improving stakeholder engagement.
Slide 5: Online course registration and attrition rate
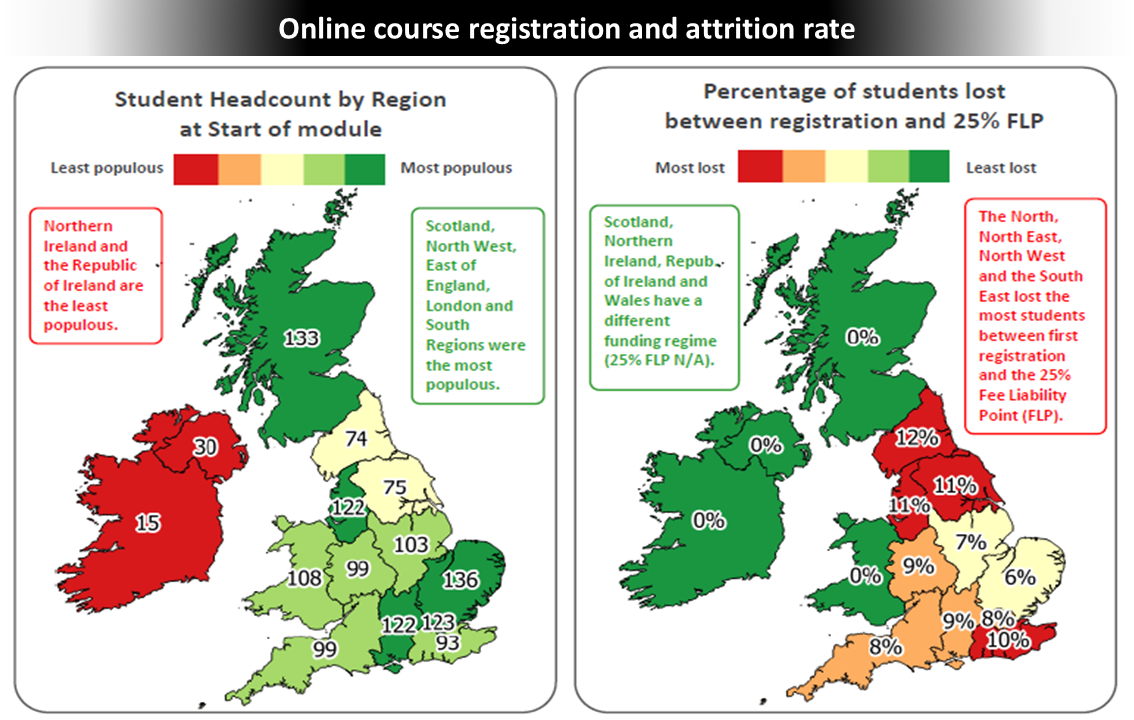
Situation: A university sought to reduce early student attrition and improve its student support function through better-targeted early interventions.
Actions: I analysed registration and attendance data and identified geographic patterns linked to higher early engagement. This led to deeper analysis at local levels and the design of algorithmic interventions that automatically routed eligible students to preparatory taster courses.
Results: The interventions strengthened early student engagement, supported the development of study skills, and contributed to reduced early attrition from undergraduate modules.
Slide 6: Flood Zone maps and critical infrastructure
Situation: A local authority and its emergency planning partners needed better tools to understand flood risk and its potential impact on critical infrastructure.
Actions: I developed an interactive tool and a suite of digital maps using Environment Agency flood zone data, combined with spatial mapping of critical infrastructure assets.
Results: The outputs improved emergency preparedness and coordination, enabling planners and responders to identify high-risk assets and plan more effective flood response strategies.
Slide 7: Flood Zone & critical infrastructure – residential dwelling risk
Situation: Emergency planners needed detailed, actionable intelligence on which residential properties and individuals could be affected by extreme weather or infrastructure failures.
Actions: I created a dynamic address-level database integrated with an online form application, allowing emergency services to log and confirm attempted contact with residents in at-risk properties.
Results: The solution enhanced situational awareness during incidents, improved accountability in resident contact efforts, and strengthened emergency response and safeguarding processes.
Slide 8: Targeting High-Yield Areas for a Charity Fundraising Team
Situation: A charity needed a more effective, data-driven approach to target areas with the highest potential fundraising yield.
Actions: I produced a series of analytical bulletins that triangulated ONS and demographic data with the charity’s internal fundraising data to identify high-potential locations.
Results: The work enabled the fundraising team to adopt a clear operating framework, focusing ambassador efforts on areas most likely to generate support and improving fundraising efficiency.
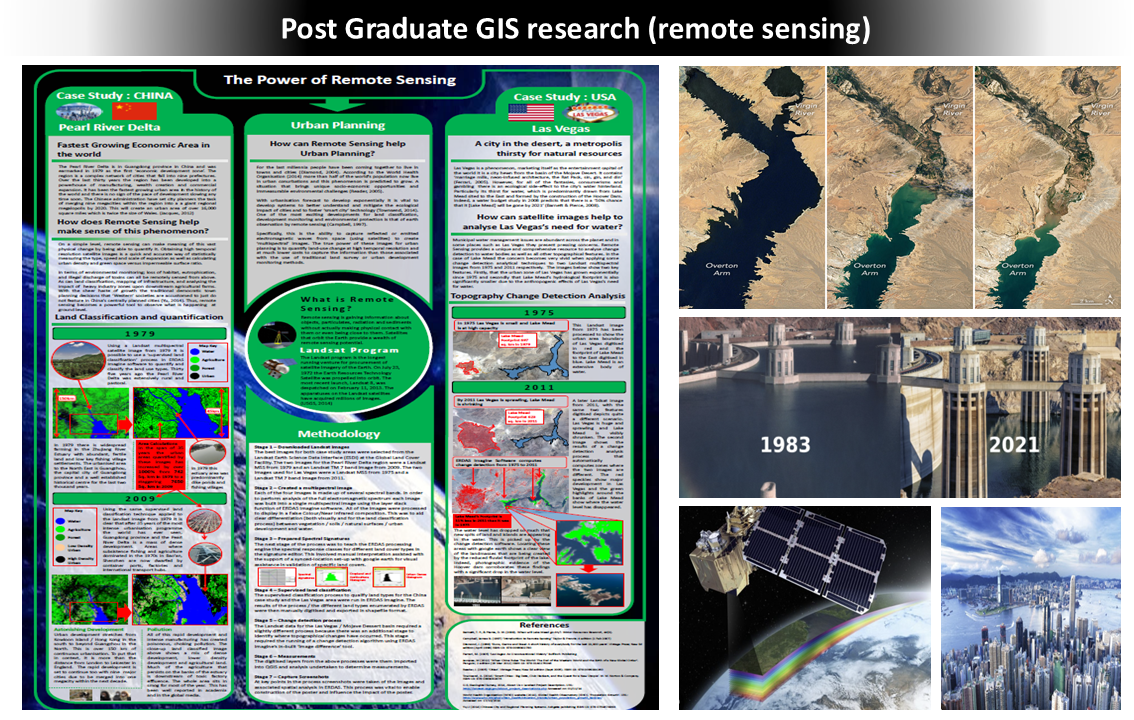
Slide 9: Post Graduate GIS research (remote sensing)
Situation: Urban land-use change can significantly exacerbate municipal water shortages in rapidly developing, water-stressed regions. This is one of the most pressing issues of the 21st century.
Actions: I conducted postgraduate GIS research using time-series analysis of Landsat and Sentinel satellite imagery, resulting in a dissertation and a summary poster. The study examined urban growth and water scarcity in Lake Mead (USA) and the Pearl River Delta (China).
Results: The research demonstrated how remote sensing can effectively model relationships between urbanisation and the intensity and duration of water shortages, contributing academic insights into sustainable urban and water resource planning.
