


Slide 1: Census insight analysis pack
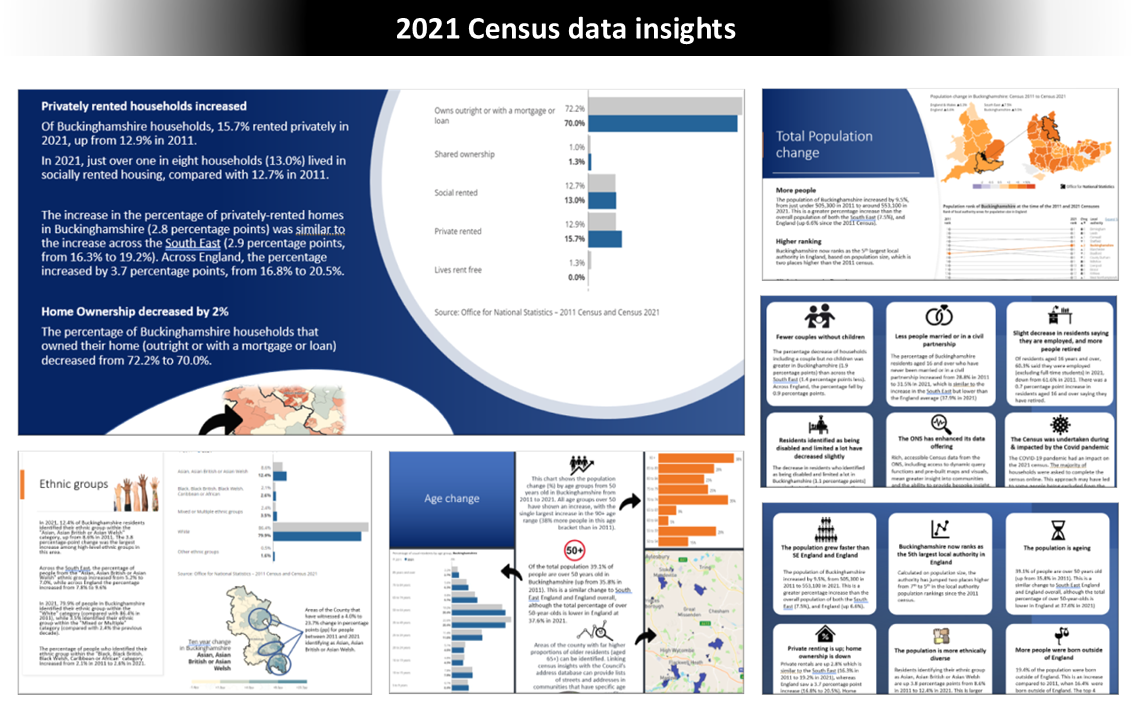
Situation: I was commissioned to summarise national census results for a local authority, focusing on significant demographic changes and actionable insights.
Actions: I created an engaging analysis pack highlighting key findings, including increases in the Eastern European diaspora and multigenerational households, as well as shifts towards renting and changes in family dynamics.
Results: The insights guided the CEO and senior leadership in better understanding the county’s changing demographics. The work directly supported decision-making, prompting the establishment of community engagement teams to support diverse communities as well as an examination of affordable housing needs and area strategy.
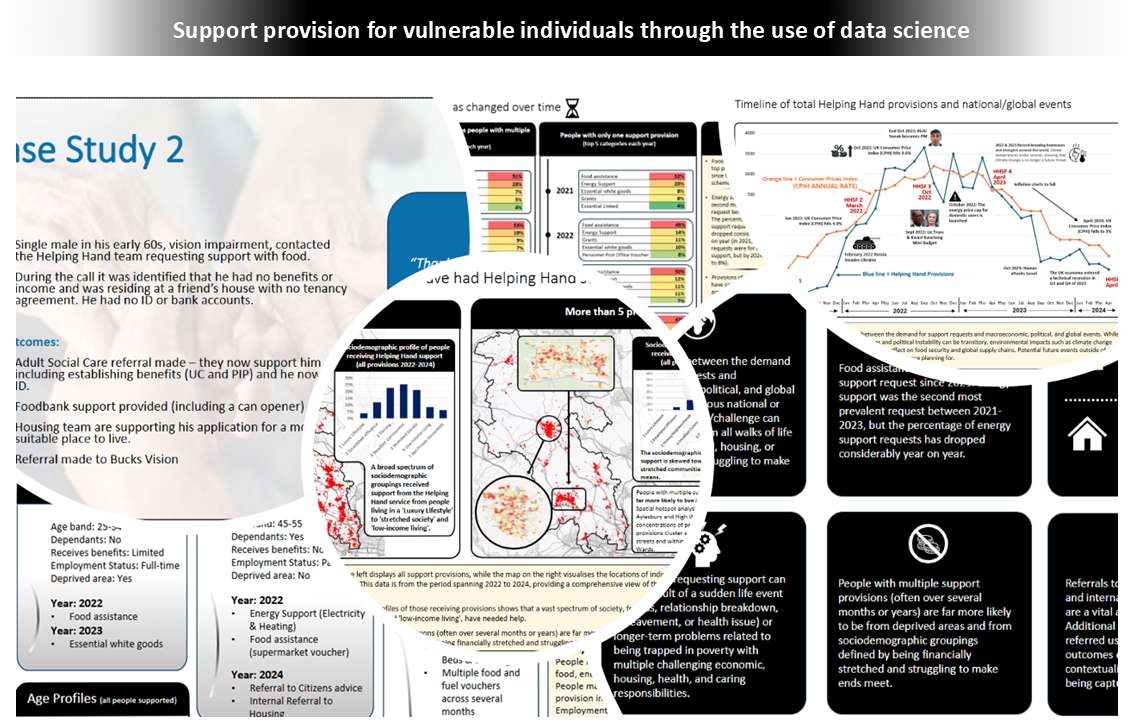
Slide 2: Data science deep dive into support provision for vulnerable people
Situation: A charitable “Helping Hand” service sought a deeper understanding of its users. This included identifying the most common circumstances and situations that led them to experience financial hardship and require urgent support. The brief also aimed to assess the potential impact of funding changes on the service and explore how to redirect demand by signposting users to other support resources.
Actions: I led the project, including deep-dive quantitative analyses of support requests, demographic profiling, and text analysis of case notes. I co-developed predictive models to assess the impacts of economic conditions on service usage and related public services.
Results: The work delivered a holistic evidence base that improved understanding of vulnerable support needs, identified key drivers of demand, and provided forward-looking insights to inform funding decisions and anticipate pressure on related public services.
Slide 3: Analysis of departmental performance-related pay
Situation: A large organisation needed to ensure its performance-related pay framework was applied fairly and consistently across departments.
Actions: I conducted forensic analysis of several years’ worth of data, combining departmental performance data with metrics such as staff sickness, turnover rates, budget management, health & safety incidents and complaints.
Results: The analysis provided the organisation with assurances of fairness in pay distribution and identified areas for improvement in the application of the performance-related pay framework.
Slide 4: Analytical deep dive into organisational support groups
Situation: A large organisation sought clarity on its employee support groups to ensure alignment with corporate strategy and assess operational efficiency.
Actions: I reviewed support groups, examining membership, remits, and strategic alignment through stakeholder engagement. I synthesised findings into a presentation for senior stakeholders.
Results: Insights showed that an excessive number of support groups led to confusion among employees seeking help. This led leadership to implement my recommendations to streamline support, reduce the number of groups, and enhance record-keeping.
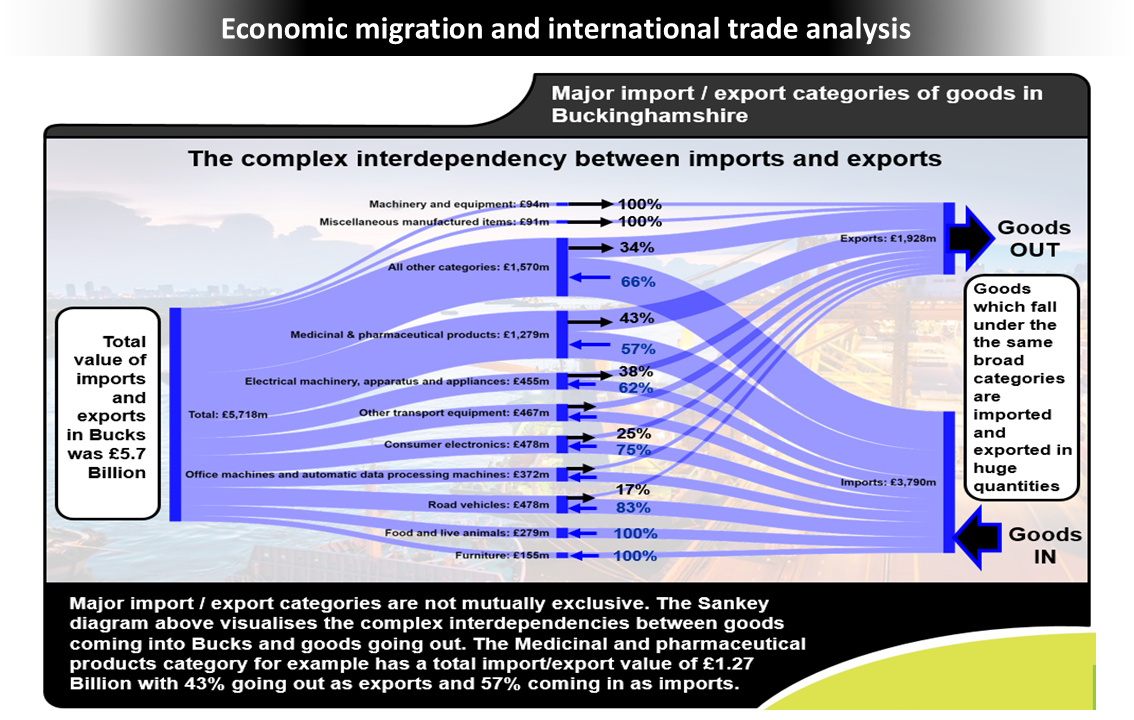
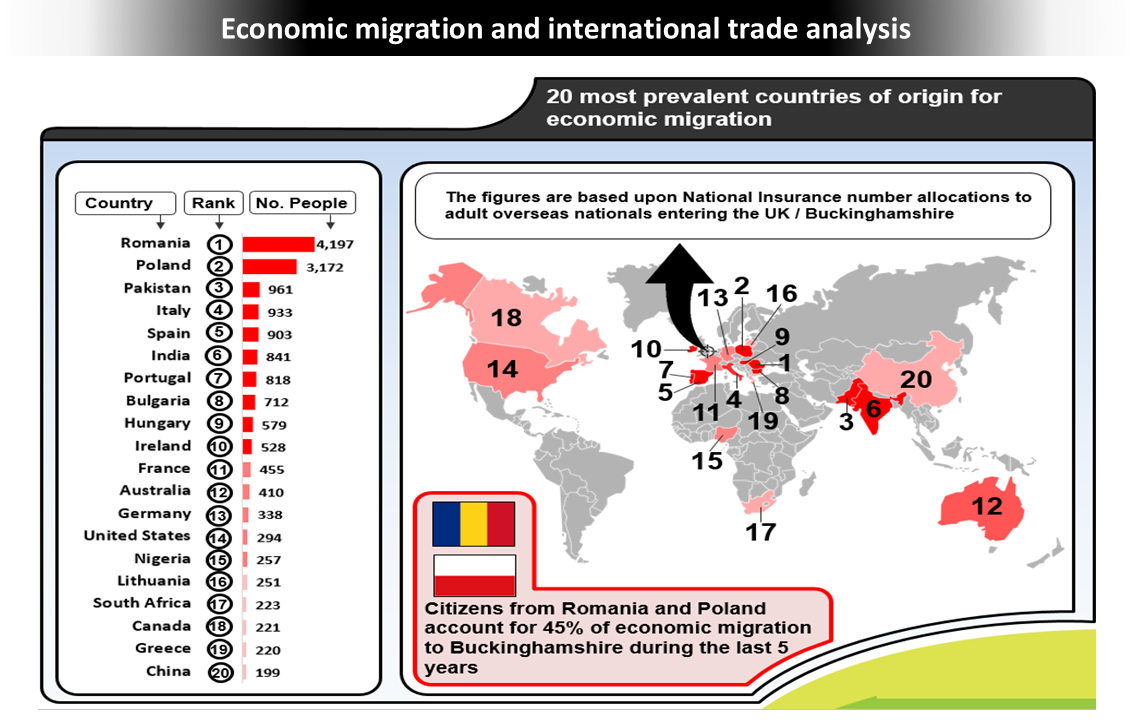
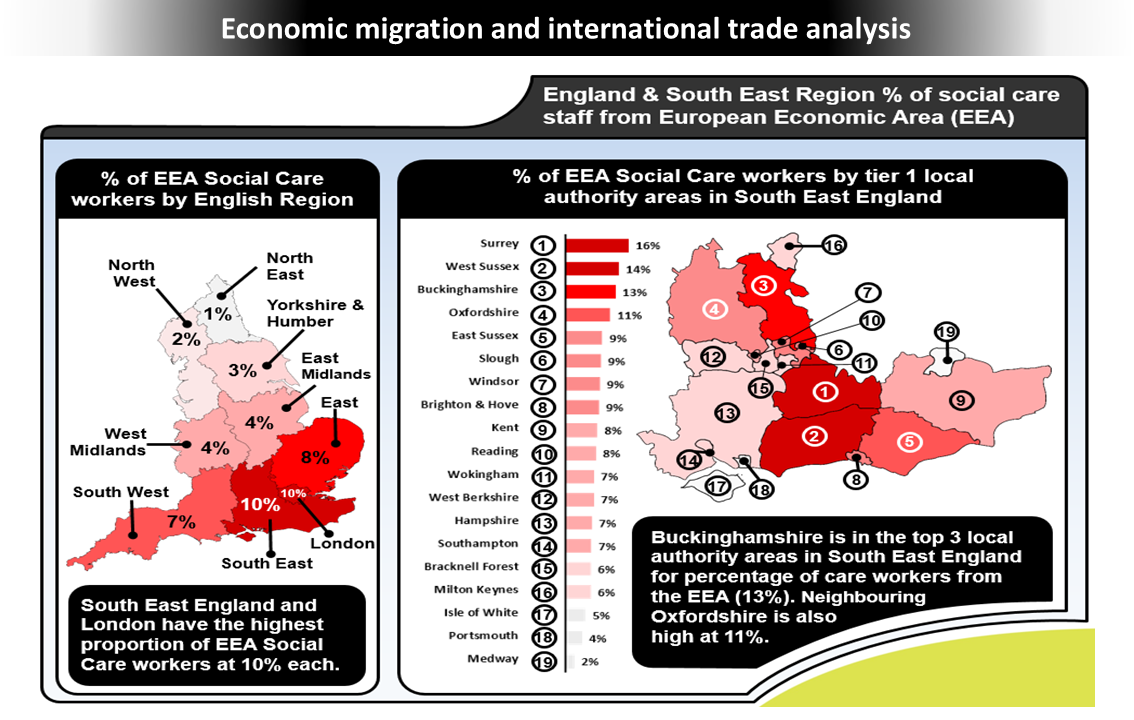
Slides 5-10: Economic migration and international trade analysis
Situation: National census data revealed an increase in international migration to Buckinghamshire, prompting political interest in the origins of new arrivals and the impact of Brexit. The analysis also investigated business exports by region and country to inform economic strategy.
Actions: Utilising DWP and ONS open data, I created a comprehensive insight pack to support policy development, map migrant workers, and analyse skills shortages. The work also looked into the best ways to target initiatives for skills improvement programmes.
Results: This work had a significant impact and was showcased nationally at a Local Government Association forum. It put the authority on the radar as being one of the most prepared councils in England, seeking to understand and capitalise on the post-Brexit economic environment.
Slide 11: Poster for an international conference
Situation: A leading remote learning university aimed to promote analytics and data science to foster cultural change among staff.
Actions: I designed a poster for an international conference to showcase the university’s global analytics strategy and leadership in data science for large-cohort universities.
Results: The poster sparked engaging discussions and included a survey to collect feedback on predictive analytics for assessing student grades, helping shape ethical strategies for future data use.
Slide 12: Key performance indicator visualisation
Situation: A new chief executive at a local authority sought to improve efficiency and reduce duplication by reviewing the excessive number of key performance indicators (KPIs) being reported across the organisation.
Actions: As part of the work, I developed a concise data visualisation to demonstrate the overuse of Key Performance Indicators (KPIs) to the CEO and the Corporate Management Team. This visual was also replicated for each department and used to engage service heads, highlighting the challenges posed by overly complex, numerous KPIs. The goal was to stimulate discussion and gather more insights on their KPIs and the reasoning behind them.
Results: The analysis revealed a complex performance reporting process that, as the CEO had rightly identified, was overly complex, with too many KPIs. The work prompted the commission of a project (which I led) to completely streamline, revamp, and systemise KPI reporting across the authority.
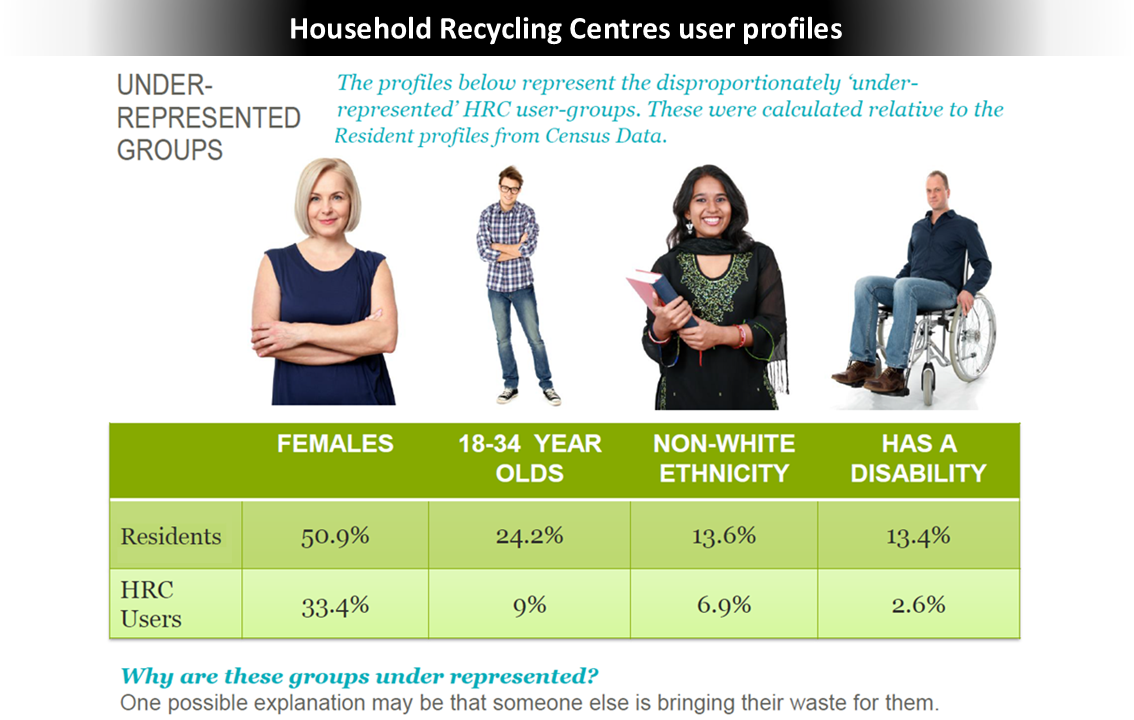
Slides 13&14: Household Recycling Centres user profiles
Situation: A local authority needed to redevelop its household recycling centre strategy due to significant cost pressures. This involved merging some centres and better managing visitor numbers. They needed to implement a booking system because there was evidence of commercial waste being repeatedly dumped for free by individuals posing as residential householders. Part of the project involved commissioning and analysing a survey of residents and current service users. My role in the project was to develop a narrative and presentation based on the survey results.
Actions: I created an impactful series of visualisations which showcased user profiles from the local survey of Household Recycling Centres. Presented to a non-technical steering group, the data was made more relatable and sparked meaningful discussions on inclusivity and the future operating model.
Results: The project resulted in the development of an online booking system, improved signage, and enhanced support options for individuals with disabilities. These changes helped transform the processes at recycling centres, improve user experiences, and save money.
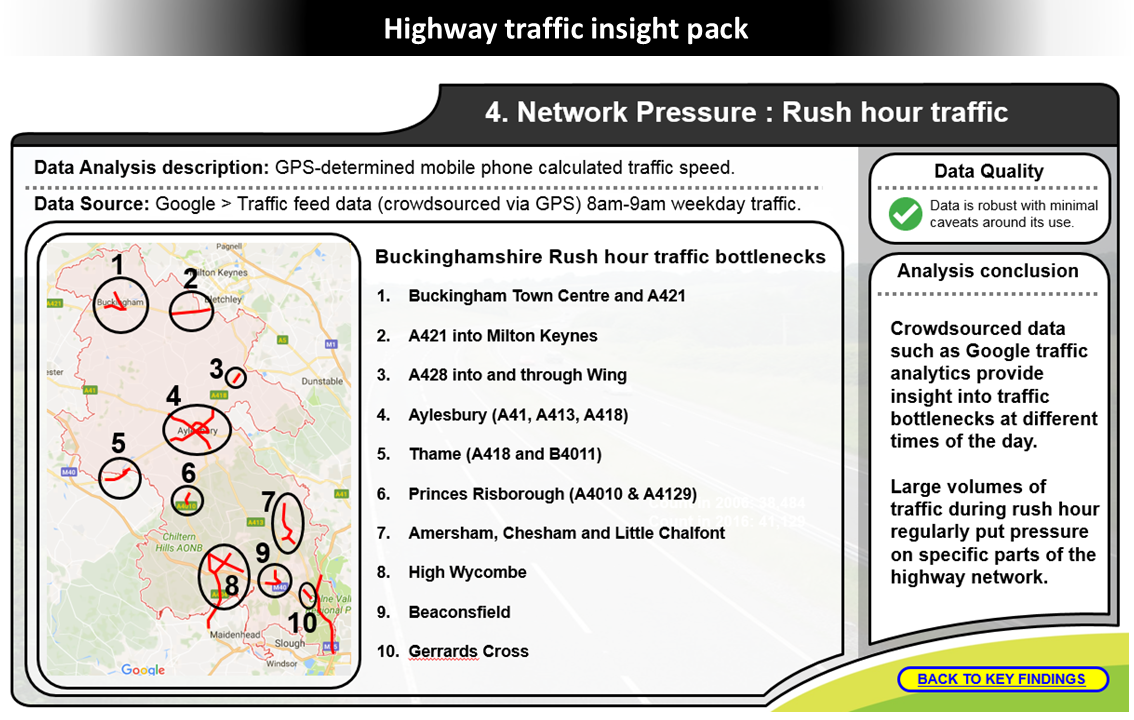
Slides 15-17: Highway traffic insight pack
Situation: Budget constraints and ongoing road repairs prompted a comprehensive analysis request of a local authority’s highways department operations.
Actions: I conducted a deep-dive review that highlighted traffic usage, pressures, and areas for improvement, creating a visually engaging insight pack suitable for both technical and non-technical audiences.
Results: The findings revealed increasing traffic volumes, particularly of LGVs and HGVs, informing future spending strategies and operational improvements for the highways department.
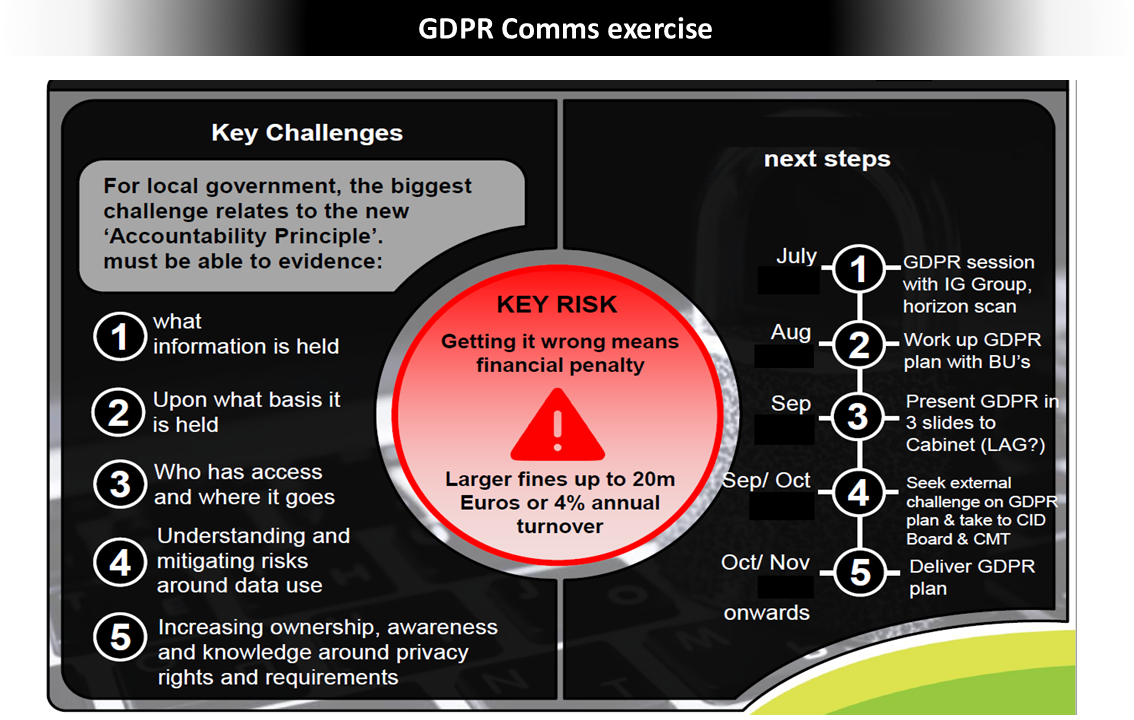
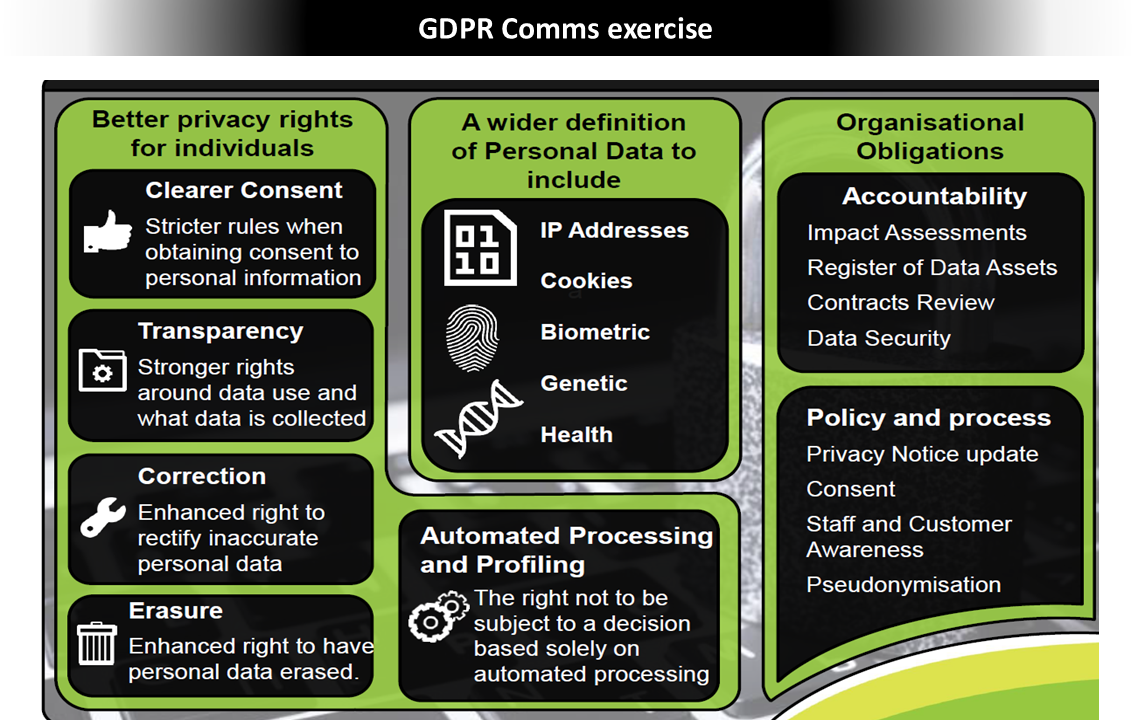
Slides 18-20: GDPR Comms exercise
Situation: An organisation needed to raise awareness and understanding of GDPR data protection rules as part of a wider engagement and communications initiative.
Actions: I designed clear, accessible data visualisations for a slide deck, translating GDPR requirements into engaging visuals suitable for a broad, non-technical audience.
Results: The visualisations supported effective communication of GDPR principles, improving engagement and helping staff better understand their data protection responsibilities.
