
Slide 1&2: Corporate Performance Dashboard
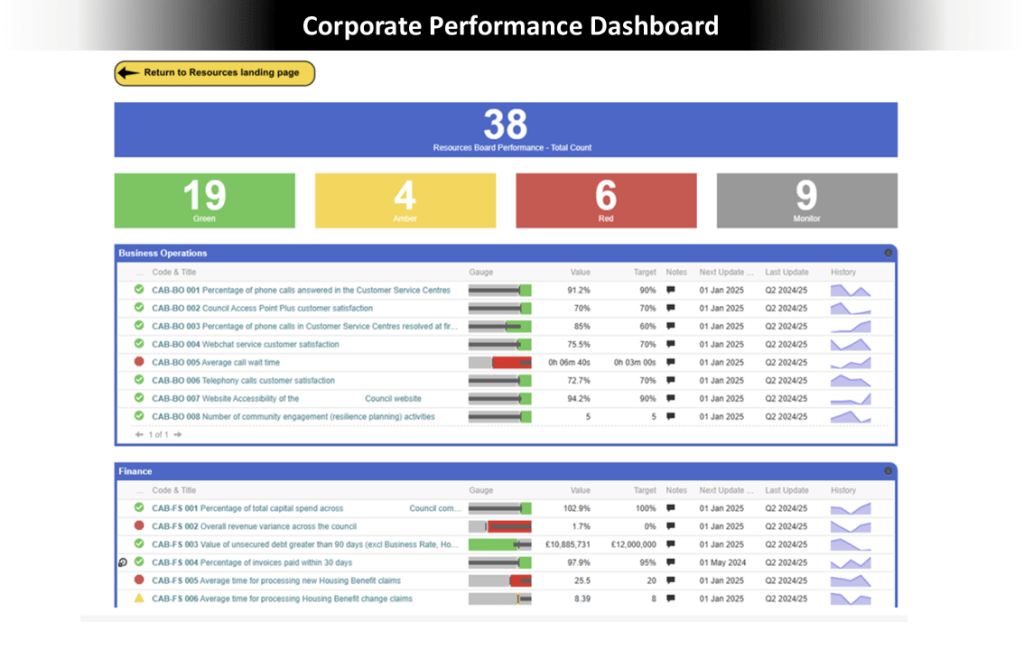
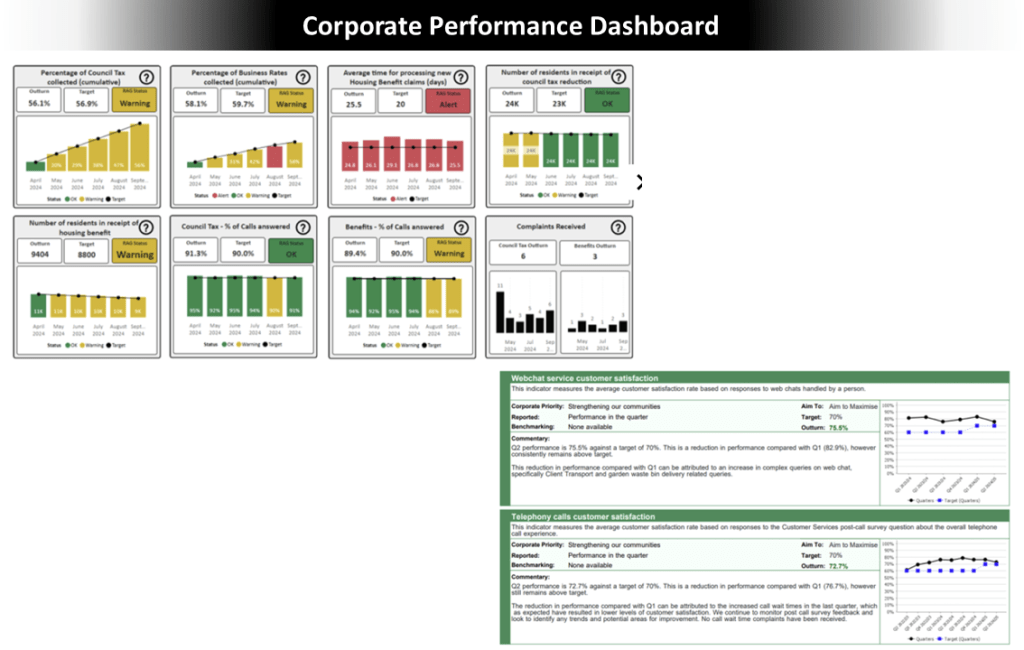
Situation: The corporate management team lacked visibility of workload volumes, productivity, service performance, and customer satisfaction, leading to delayed identification of operational, reputational, and financial risks. Data was scattered across systems, with no unified view for senior leaders.
Actions: I led a project to design a corporate performance dashboard, creating a project and communications plan, facilitating workshops for common metrics, and automating reporting where possible. Data was consolidated into a Power BI app.
Results: The dashboard improved oversight, allowing earlier risk identification and root cause analysis. It evolved to include narratives and dynamic notes, enhancing communication and accountability.
Slide 3: Risk Management System Programme
Situation: The organisation relied on fragmented Excel spreadsheets for risk management, limiting visibility and audit trails. A centralised system was needed to manage risks and strengthen governance effectively.
Actions: I captured requirements, developed the project scope, and managed procurement. Working with the vendor, I configured a cloud-based system with custom landing pages and automated reporting. I also implemented a structured training approach.
Results: The new system improved oversight and efficiency, reducing manual tasks and enabling consistent risk escalation. Transparent audit trails supported governance, enabling the organisation to transition to proactive risk management.
Slide 4: Information Governance & Complaints Reporting
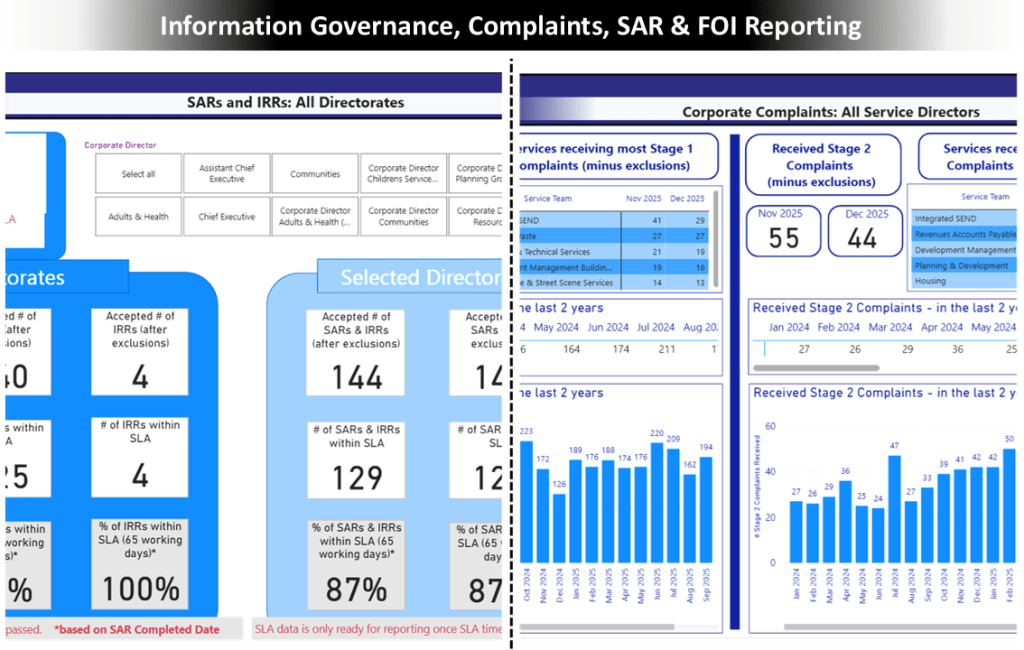
Situation: The corporate complaints system lacked strategic reporting capabilities, requiring manual data extraction for compliance reports, which took a week each month. Leaders needed automated visibility of complaints against SLAs.
Actions: I identified an API-based data feed, collaborated with the complaints team to define business rules, and built a Power BI dashboard. I conducted user training and created reusable documentation.
Results: The dashboard automated reporting, which refreshed data twice daily, freeing staff to resolve complaints and improve performance. Skills gained led to innovations, including a new FOI dashboard that enhanced long-term analytical capabilities.
Slide 5: Business Continuity Management (BCM) Compliance Reporting
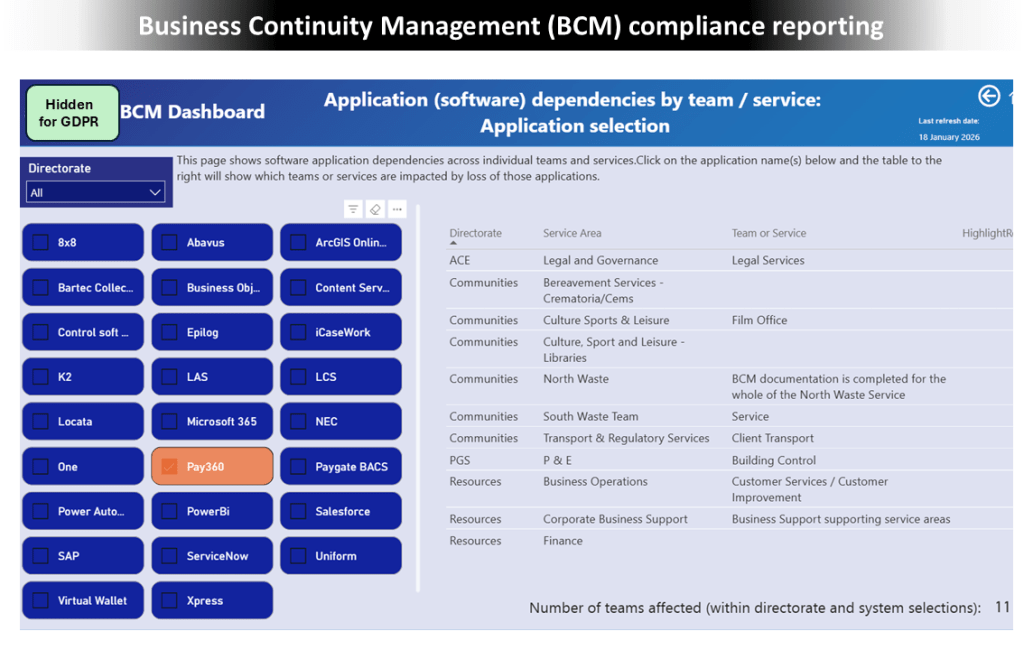
Situation: Over 100 departments struggled to maintain up-to-date business continuity plans. An external audit warned that during major incidents—like cyber failures or pandemics—the authority would face delays in delivering minimum statutory services due to unclear ownership and hidden dependencies in outdated plans.
Actions: I designed an automated solution that scanned SharePoint for document update dates and extracted key data. This was consolidated into a Power BI dashboard for easy departmental filtering. I created a system-ownership lookup to highlight dependencies and designate a single contact per critical system, and deployed the dashboard via Power BI cloud services.
Results: The solution eliminated manual searches, reduced administrative effort, and provided real-time visibility into BCM compliance. External auditors praised the improvements in resilience and incident response capability.
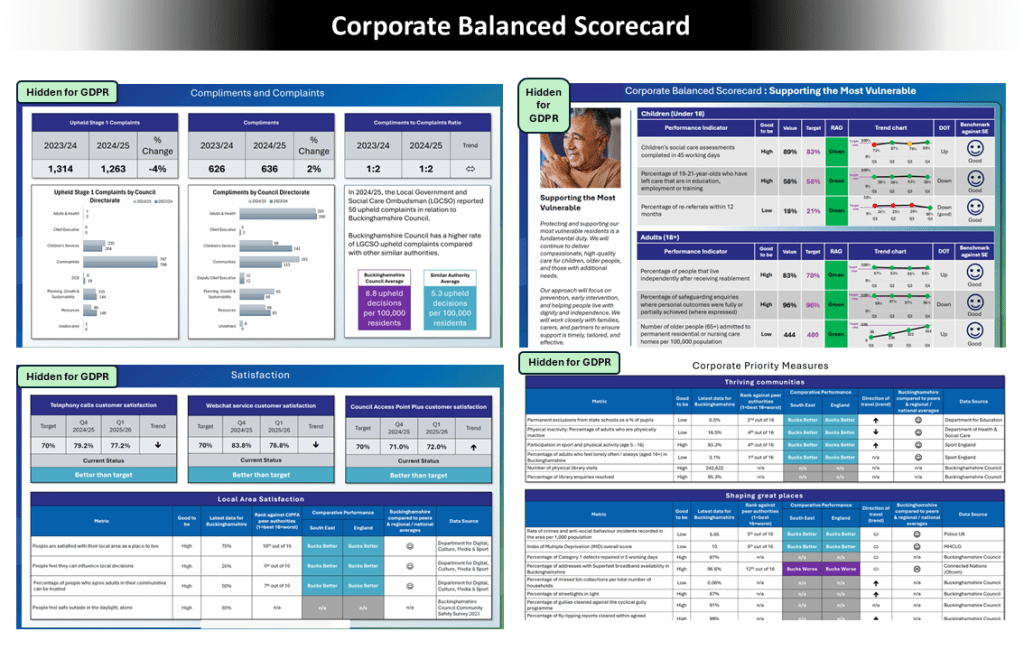
Slide 6: Corporate Balanced Scorecard
Situation: The CEO and Leader of a local authority wanted a balanced scorecard that supported public scrutiny and aligned with local and government metrics. It needed to benchmark performance against peer authorities and involve input from a residents’ working group.
Actions: I designed multiple scorecard options, tested layouts and metrics with stakeholders, and facilitated discussions to align diverse perspectives. Collaborating with Corporate Communications, I ensured accessibility and delivered a visually engaging scorecard along with a screen-reader-accessible text version.
Results: The chosen scorecard was well-received, enabling consistent monitoring of key metrics and enhancing accountability. It improved transparency and trust through effective benchmarking against peers and regional and national averages.
